자료를 표현하는 다양한 방법은 데이터를 효과적으로 분석하는데 중요한 역할을 합니다. 따라서, 각 유형의 데이터와 특성에 맞는 시각화 방법을 사용하는 것이 중요합니다. R로 설명하며, 대표적인 그래프 패키지인 ggplot을 이용하여 글을 작성하겠습니다.
범주형 단변수 자료형
범주형 데이터는 명확한 범주를 가지는 변수입니다. 이를 시각화하는데 다음과 같습니다.
기본 막대차트(Bar plot)

기본 막대차트는 범주별로 값의 빈도를 시각적으로 보여주는 가장 기본적인 방법입니다.
data <- data.frame(category = factor(c("A", "B", "C", "A", "B", "A", "C", "A", "B", "C")))

ggplot(data, aes(x = category)) +
  geom_bar(fill = "blue") +
  ggtitle("기본 막대차트") +
  theme_minimal()
그룹 막대 차트(Side By Side Bar plot)

그룹 막대차트는 두 개 이상의 범주를 비교할 때 사용됩니다. 막대가 나란히 배치되어 비교가 용이합니다.
data2 <- data.frame(
  category1 = factor(sample(c("A", "B", "C"), 100, replace = TRUE)),
  category2 = factor(sample(c("X", "Y"), 100, replace = TRUE))
)

ggplot(data2, aes(x = category1, fill = category2)) +
  geom_bar(position = "dodge") +
  ggtitle("그룹 막대 차트") +
  theme_minimal()
Stacked Bar plot
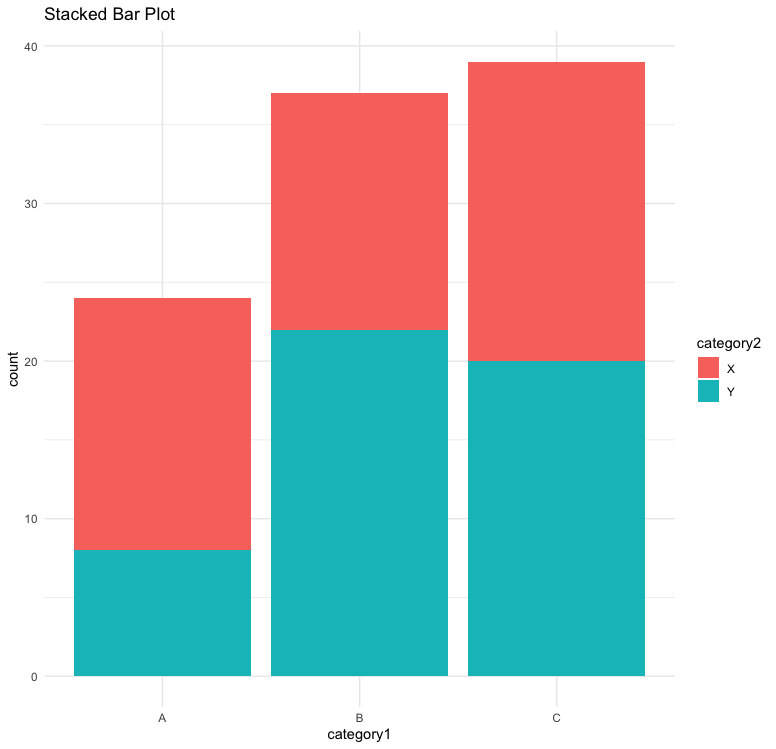
Stacked Bar plot은 그룹별로 범주 데이터를 누적하여 비교하는 차트입니다.
ggplot(data2, aes(x = category1, fill = category2)) +
  geom_bar(position = "stack") +
  ggtitle("Stacked Bar Plot") +
  theme_minimal()
파이차트(Pie Chart)
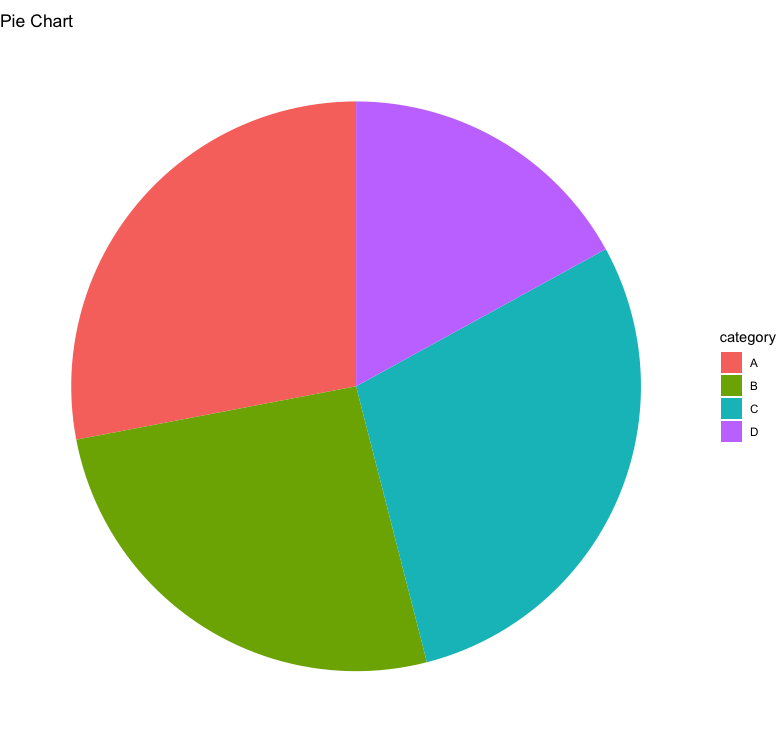
Pie Chart는 전체 중에서 각 범주가 차지하는 비율을 원형으로 표현하는데 사용됩니다.
data_pie <- data %>%
  count(category) %>%
  mutate(percentage = n / sum(n))

ggplot(data_pie, aes(x = "", y = percentage, fill = category)) +
  geom_bar(stat = "identity", width = 1) +
  coord_polar("y") +
  ggtitle("Pie Chart") +
  theme_void()
도넛차트(Donut Chart)

install.packages("ggplot2")
library(ggplot2)

data <- data.frame(
    category = c("A", "B", "C", "D"),
    value = c(30, 20, 40, 10)
)

ggplot(data, aes(x = 2, y = value, fill = category)) +
    geom_bar(stat = "identity", width = 1) +
    coord_polar("y", start = 0) +
    labs(title = "Donut Chart") +
    xlim(0.5, 2.5) +  # 가운데 구멍 만들기
    theme_void()
연속형 단변수 자료형
연속형 데이터는 주로 수치적 변동을 나타내며, 히스토그램, 밀도 그래프 등으로 표현됩니다.
연속형 데이터는 숫자로 된 값으로, 일반적으로 히스토그램이나 확률밀도함수 같은 방법으로 시각화됩니다.
히스토그램(Histogram)
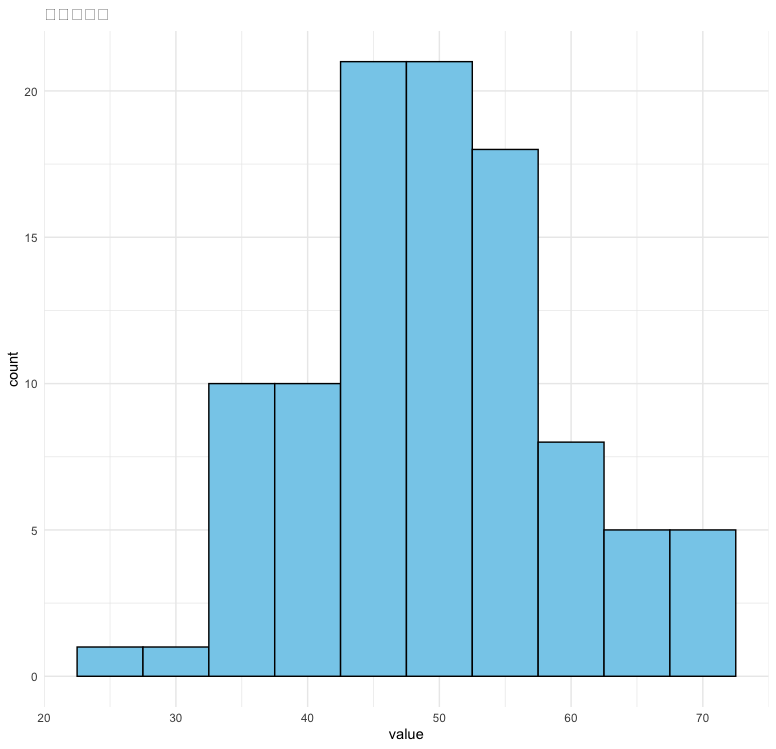
data <- data.frame(value = rnorm(100, mean = 50, sd = 10))

ggplot(data, aes(x = value)) +
  geom_histogram(binwidth = 5, fill = "skyblue", color = "black") +
  ggtitle("히스토그램") +
  theme_minimal()
확률밀도함수

확률밀도함수는 연속형 데이터가 특정 값에 나타날 확률을 보여줍니다.
ggplot(data, aes(x = value)) +
  geom_density(fill = "lightgreen") +
  ggtitle("확률밀도함수") +
  theme_minimal()
확률밀도함수 Bar plot overay
이 차트는 히스토그램과 밀도함수를 겹쳐서 연속형 데이터의 분포를 비교하는 방법입니다.
ggplot(data, aes(x = value)) +
  geom_histogram(aes(y = ..density..), binwidth = 5, fill = "skyblue", color = "black") +
  geom_density(fill = "lightgreen", alpha = 0.3) +
  ggtitle("확률밀도함수 + Bar plot overlay") +
  theme_minimal()
Quantile-Quantile Plot(Q-Q Plot)

Q-Q Plot은 데이터의 분포가 정규분포를 따르는지 비교할 때 유용한 도구입니다.
qqnorm(data$value)
qqline(data$value, col = "red")
연속형 단변수와 범주형 단변수의 표현
상자형 그림 Box Plot

상자형 그림은 중앙값, 사분위수, 이상치를 시각적으로 나타냅니다.
ggplot(data, aes(x = factor(sample(c("A", "B", "C"), 100, replace = TRUE)), y = value)) +
  geom_boxplot() +
  ggtitle("상자형 그림") +
  theme_minimal()
연속형 이변수 자료 표현하기
산점도

data$value2 <- rnorm(100, mean = 30, sd = 5)

ggplot(data, aes(x = value, y = value2)) +
  geom_point(color = "blue") +
  ggtitle("산점도") +
  theme_minimal()
다변수 자료표현
모자이크 그림

모자이크 그림은 범주형 데이터를 시각적으로 비교하는 방법으로, 각 범주 간의 교차 빈도를 나타냅니다.
ggplot(data2) +
  geom_mosaic(aes(x = product(category1, category2), fill = category1)) +
  ggtitle("모자이크 그림") +
  theme_minimal()
다중 산점도
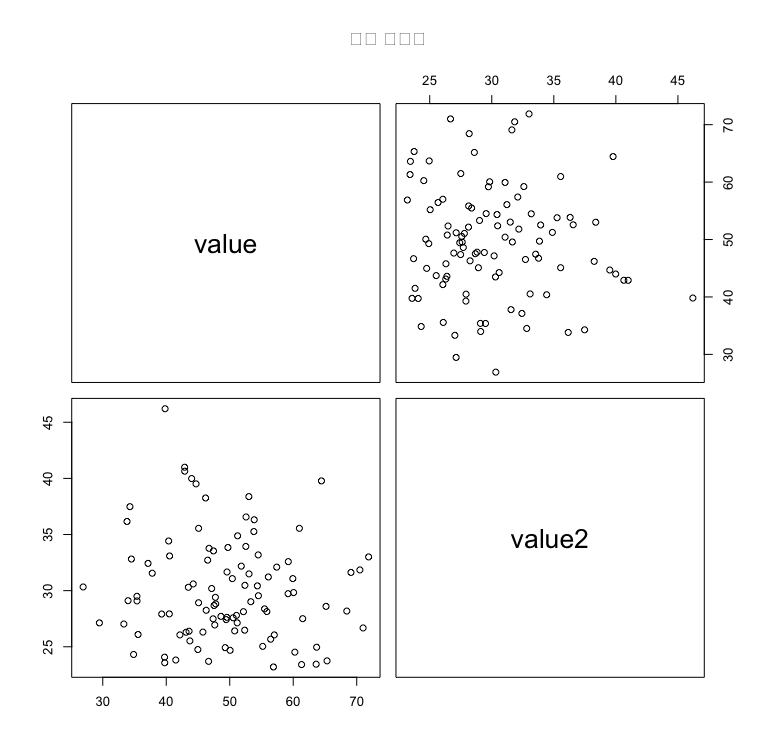
다중 산점도는 여러 변수 간의 상관관계를 비교합니다.
pairs(data[, c("value", "value2")], main = "다중 산점도")나무지도 그림(Treemap)

나무지도 그림은 계층적 데이터를 사각형 크기로 비교합니다.
data_treemap <- data.frame(
  category = factor(sample(c("Group 1", "Group 2", "Group 3"), 100, replace = TRUE)),
  subcategory = factor(sample(c("A", "B", "C", "D"), 100, replace = TRUE)),
  value = runif(100, min = 10, max = 100)
)

treemap(data_treemap,
        index = c("category", "subcategory"),
        vSize = "value",
        title = "나무지도 그림")
풍선그림(Bubble plot)
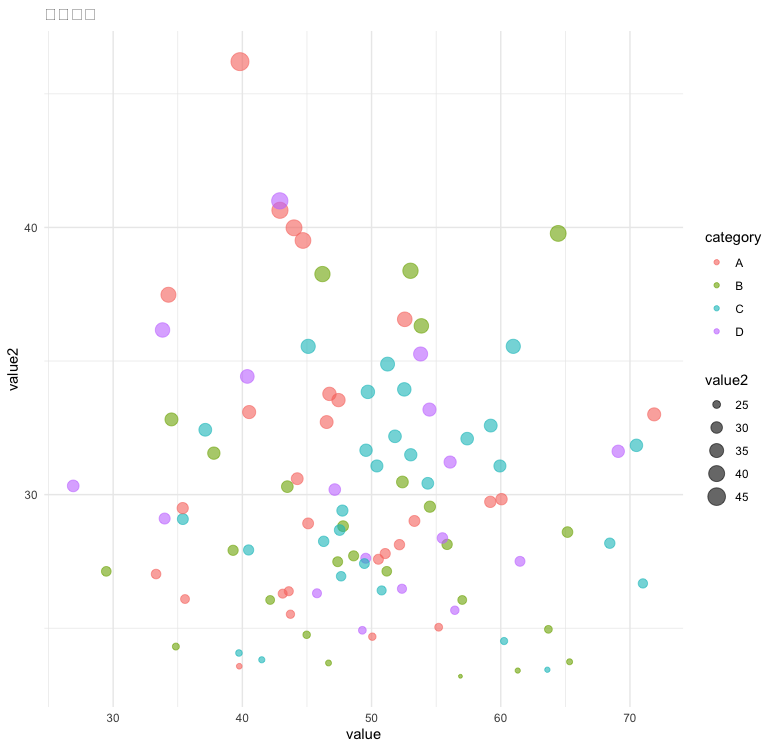
풍선그림은 산점도와 유사하나 점의 크기를 추가 변수로 표현합니다.
ggplot(data, aes(x = value, y = value2, size = value2, color = factor(sample(c("A", "B", "C"), 100, replace = TRUE)))) +
  geom_point(alpha = 0.6) +
  ggtitle("풍선그림") +
  theme_minimal()
두 변수 간의 상관관계 표현하기
상관도

상관도는 두 변수간의 상관관계를 시각적으로 표현합니다.
corr_matrix <- cor(data[, c("value", "value2")])
corrplot(corr_matrix, method = "circle")
상관도 네트워크 그림

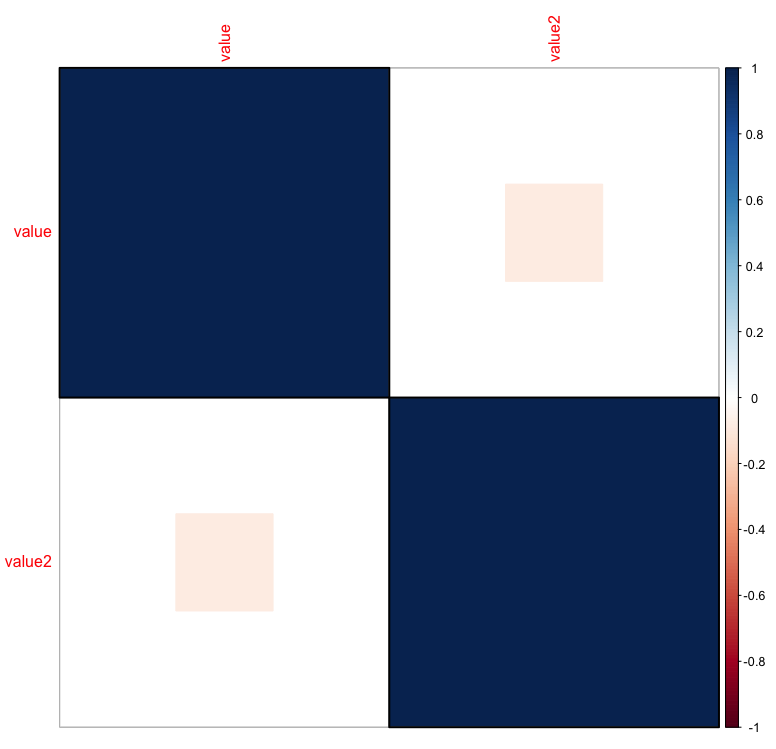
상관도 네트워크 그림은 변수가 서로 어떻게 상관관계가 있는지 네트워크 형태로 시각화합니다.
corrplot(corr_matrix, method = "ellipse")변수 군집 그림(Variable Clustering Plot)
군집 그림은 변수 간의 상관관계를 기반으로 변수를 군집화하여 표현합니다.
corrplot(corr_matrix, method = "square", order = "hclust", addrect = 2)레이더 차트

레디어 차트는 여러 변수를 한 번에 비교할 수 있는 시각화 방법입니다.
install.packages("fmsb")
library(fmsb)

data_radar <- data.frame(
  group = c("A", "B", "C"),
  Speed = c(4, 5, 3),
  Strength = c(5, 3, 4),
  Agility = c(3, 4, 5),
  Stamina = c(5, 2, 4),
  Technique = c(4, 5, 3),
  Endurance = c(3, 4, 5)
)

radar_data <- rbind(rep(5, 6), rep(0, 6), data_radar[, -1])

radarchart(radar_data,
           axistype = 1,                # 축의 형태 지정
           pcol = c("red", "blue", "green"),  # 그룹별 선 색상 지정
           pfcol = c(rgb(1,0,0,0.3), rgb(0,0,1,0.3), rgb(0,1,0,0.3)), # 그룹별 내부 색상 및 투명도
           plwd = 2,                     # 선 두께 설정
           cglcol = "grey",              # 방사형 축 선 색상
           cglty = 1,                    # 방사형 축 선 스타일 (실선)
           cglwd = 0.8,                  # 방사형 축 선 두께
           axislabcol = "black",         # 축 레이블 색상
           vlcex = 0.8,                  # 변수 이름 레이블 크기
           title = "육각형 레이더 차트")  # 차트 제목
고밀도 자료 표현하기
부드러운 산점도(Smooth Scatter Plot)

smoothScatter(data$x, data$y, main = "Smooth Scatter Plot")
투명도를 사용한 산점도 (Scatter Plot with Transparency)
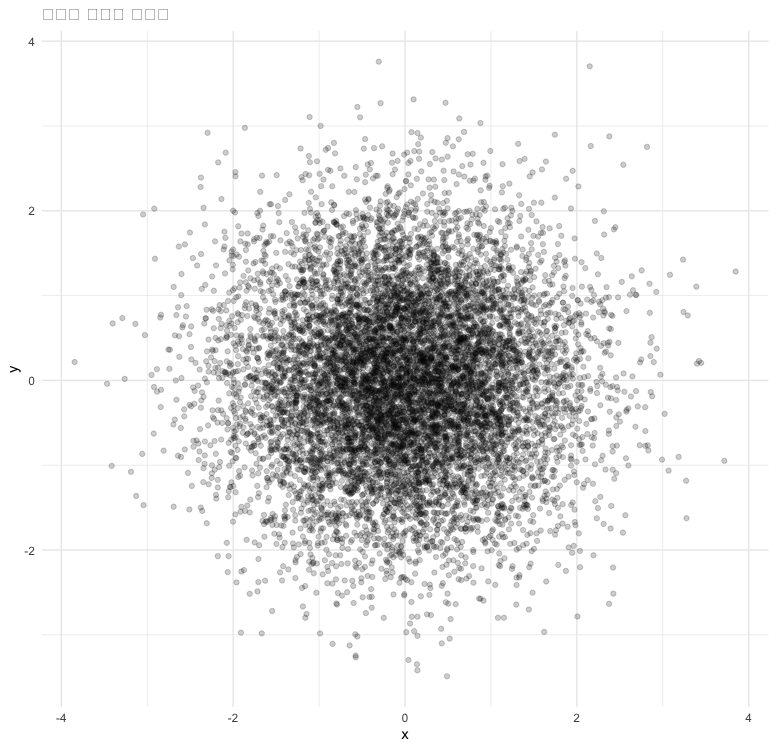
ggplot(data, aes(x = x, y = y)) +
  geom_point(alpha = 0.2) +
  ggtitle("투명도 적용한 산점도") +
  theme_minimal()
Facet Grid를 사용한 산점도

install.packages("ggplot2")
library(ggplot2)

data <- data.frame(
    x = rnorm(1000),
    y = rnorm(1000),
    category = sample(letters[1:4], 1000, replace = TRUE)  # 범주 생성
)

ggplot(data, aes(x = x, y = y)) +
    geom_point(alpha = 0.2, color = "blue", size = 1) +
    facet_wrap(~ category) +                               # 범주별로 나누기
    labs(title = "Facet Grid를 사용한 산점도", x = "X축", y = "Y축") +
    theme_minimal(base_size = 15)
바이올린 그림(Violin Plot)

install.packages("ggplot2")
library(ggplot2)

data <- iris

ggplot(data, aes(x = Species, y = Sepal.Length)) +
  geom_violin(fill = "lightblue", alpha = 0.7) +    # 바이올린 플롯
  labs(title = "바이올린 플롯", x = "Species", y = "Sepal Length (mm)") +
  theme_minimal()
등고선 그래프 (Contour Plot)

ggplot(data, aes(x = x, y = y)) +
  geom_density_2d() +
  ggtitle("등고선 그래프") +
  theme_minimal()
밀도 히트맵 (Density Heatmap)

밀도 히트맵은 산점도의 데이터를 x와 y 축으로 구분해 그 밀도를 색상으로 표현하는 방법입니다. Hexbin Plot과 비슷하지만 사각형 구역을 사용하여 밀도를 나타냅니다.
install.packages("ggplot2")
library(ggplot2)

set.seed(123)
data <- data.frame(
    x = rnorm(10000),
    y = rnorm(10000)
)

ggplot(data, aes(x = x, y = y)) +
    stat_density_2d(aes(fill = ..density..), geom = "raster", contour = FALSE) +
    scale_fill_viridis_c() +
    ggtitle("2D 밀도 히트맵") +
    theme_minimal()
히트맵
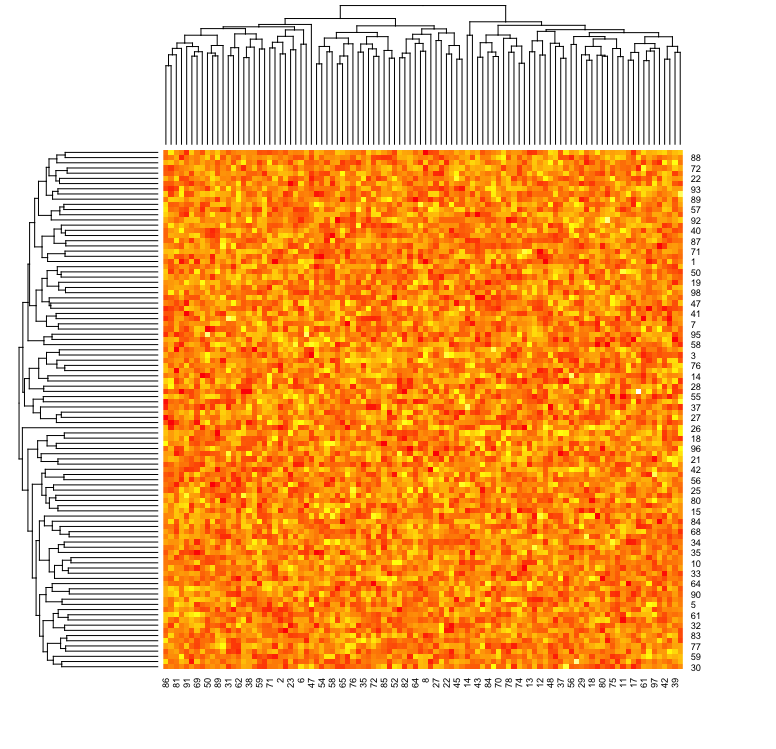
히트맵은 행과 열로 이루어진 데이터를 색상으로 표현하는 방법입니다. 각 셀은 데이터의 값을 색상으로 표현하며, 값이 클수록 더 진한 색으로 나타납니다. 고밀도 데이터를 표현할 때 데이터 포인트 간의 패턴을 빠르게 파악할 수 있습니다.
data_matrix <- matrix(rnorm(10000), nrow = 100)

heatmap(data_matrix, scale = "column", col = heat.colors(256))
2D 밀도 그림(2D Density Plot)

2D 밀도 플롯은 산점도에서 데이터가 밀집된 부분을 부드럽게 표현하기 위한 방법입니다. 이 플롯은 밀도가 높은 부분을 더 진한 색상이나 등고선으로 나타냅니다. 고밀도 구역을 시각적으로 구분하기 쉽고, 데이터가 넓게 퍼져 있을 때 유용합니다.
install.packages("ggplot2")

library(ggplot2)

set.seed(123)
data <- data.frame(
    x = rnorm(10000),
    y = rnorm(10000)
)

ggplot(data, aes(x = x, y = y)) +
    geom_density_2d() +
    stat_density_2d(aes(fill = ..level..), geom = "polygon") +
    scale_fill_viridis_c() +
    ggtitle("2D 밀도 플롯") +
    theme_minimal()
육각형 그림(Hexbin Plot)
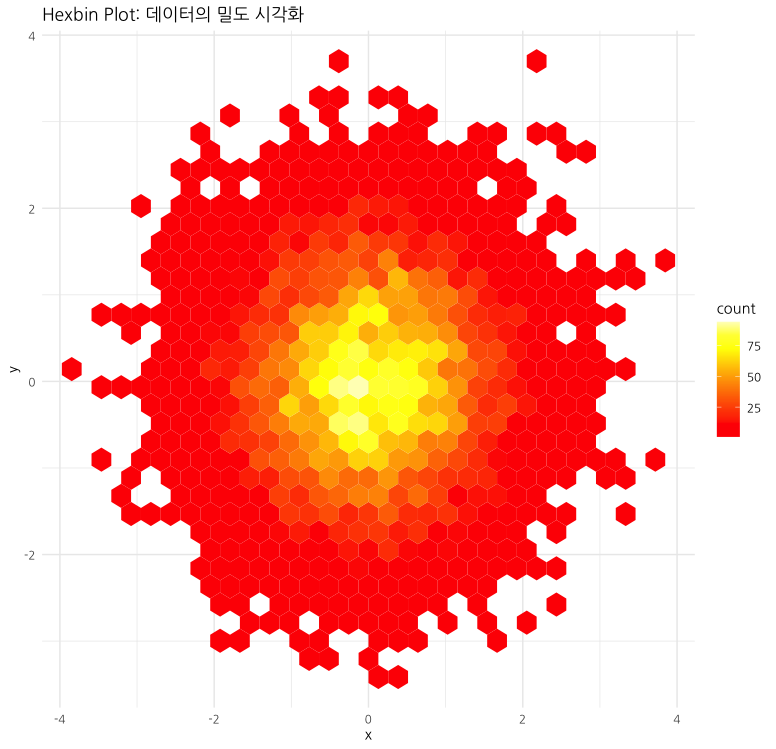
Hexbin Plot은 고밀도 데이터를 시각화하는데 유용하며, 많은 데이터 포인트가 있을때 데이터의 분포를 효과적으로 표현할 수 있습니다.
install.packages("hexbin")
install.packages("ggplot2")

library(ggplot2)
library(hexbin)

set.seed(123)  # 난수 고정
data <- data.frame(
  x = rnorm(10000),  # x축 데이터: 정규분포를 따르는 10,000개의 난수
  y = rnorm(10000)   # y축 데이터: 정규분포를 따르는 10,000개의 난수
)

ggplot(data, aes(x = x, y = y)) +
  stat_binhex(bins = 30) +                          # hexbin 설정, bin의 개수 지정
  scale_fill_gradientn(colors = heat.colors(10)) +  # 색상 팔레트 설정
  ggtitle("Hexbin Plot: 데이터의 밀도 시각화") +     # 제목 설정
  theme_minimal()                                   # 미니멀 테마
연속형 데이터표현하기
라인 차트(Line Chart)

시계열 데이터 시각화가 빠져있습니다. 만약 시계열 데이터가 포함된다면, geom_line()을 사용하는 라인 그래프도 유용합니다.
time_data <- data.frame(
  time = seq.Date(as.Date("2023-01-01"), by = "month", length.out = 12),
  value = cumsum(rnorm(12))
)

ggplot(time_data, aes(x = time, y = value)) +
  geom_line(color = "blue") +
  ggtitle("시계열 데이터 라인 차트") +
  theme_minimal()
데이터의 흐름
생키 다이어그램(Sankey Diagram)

install.packages("networkD3")
library(networkD3)

nodes <- data.frame(
    name = c("Oil", "Natural Gas", "Coal", "Fossil Fuels", "Electricity", "Energy")
)

links <- data.frame(
    source = c(0, 1, 2, 0, 1, 2),  # 각 노드의 인덱스 (nodes 데이터프레임 순서로 매칭)
    target = c(3, 3, 3, 4, 4, 5),  # 도착 노드
    value = c(10, 20, 30, 25, 35, 40)  # 흐름의 크기 (두 노드 사이의 연결 강도)
)

sankeyNetwork(Links = links, Nodes = nodes,
              Source = "source", Target = "target",
              Value = "value", NodeID = "name",
              fontSize = 12, nodeWidth = 30)
프로세스 흐름도(Flowchart)

install.packages("DiagrammeR")
library(DiagrammeR)

grViz("
    digraph flowchart {
      A -> B -> C;
      B -> D;
      C -> E;
      E -> F;
}")
타임라인차트

install.packages("ggplot2")
library(ggplot2)

events <- data.frame(
  event = c("Start", "Phase 1", "Phase 2", "Phase 3", "Completion"),
  start = as.Date(c("2020-01-01", "2020-02-01", "2020-06-01", "2020-12-01", "2021-03-01")),
  end = as.Date(c("2020-01-15", "2020-05-31", "2020-11-30", "2021-02-28", "2021-06-30")),
  progress = c(100, 80, 60, 40, 0)  # 진행 상황을 백분율로 표현
)

ggplot(events, aes(x = start, xend = end, y = event, yend = event)) +
  geom_segment(size = 8, aes(color = as.factor(progress))) +  # 기간 표시 (막대형), 진행상황별 색상
  geom_point(aes(x = end, y = event, color = as.factor(progress)), size = 5) +  # 각 이벤트 끝에 점 추가
  geom_text(aes(x = end, label = paste(progress, "%")), hjust = -0.5, size = 4) +  # 진행 상황 표시
  geom_vline(xintercept = as.numeric(Sys.Date()), linetype = "dashed", color = "red") +  # 현재 날짜 표시
  labs(title = "Enhanced Project Timeline", x = "Date", y = "Project Phases") +
  theme_minimal() +
  scale_color_brewer(palette = "Blues") +  # 색상 팔레트 설정
  theme(legend.position = "none")  # 범례 제거
'R' 카테고리의 다른 글
| Rlang에 대해서 알아보자 (0) | 2024.09.13 |
|---|